Hospice Utilization - Patient Demographics
Description of the data
The dataset contains counts of inpatient visits leading to a discharge to hospice care. Inpatient visits included in the counts consist of individuals aged 18 or over with a discharge disposition leading to home or facility hospice care. The total counts per each individual year can be viewed based on different patient characteristics, including patient age groups, individual counties of residence, primary payer type, diagnosis category, and patient sex/race/ethnicity. The disease categories include circulatory conditions, diabetes, malignant/benign neoplasms, malnutrition, neurodegenerative disease, renal failure or other kidney diagnoses, respiratory conditions and circulatory conditions. The categories represent common groupings of diagnoses seen in other studies related to hospice care and were created by grouping together relevant medical MSDRG codes in the HCAI inpatient data.
https://data.chhs.ca.gov/dataset/hospice-utilization-patient-demographics
Notice the spatial/geographic coverage of this data is at the county level for California
First, always look at the data dictionary for the data source you are looking at. It is important that you always remember to 'dig deep' into the data, and this is a good example. The data dictionary suggests that there are five fields in this dataset but the reality is that there is much more data than the dictionary suggests.
It is very common to see data in this format. Data in this format is unusable. It needs to be reorganized so that it is more useful to answer our questions.
Research Questions
Using this dataset, use EXCEL to reshape the data so that a statistical analysis that addresses the following questions can be performed. Create a simple bar chart and a map that illustrates the differences.
- RQ1: Are historically marginalized groups more likely to receive a discharge disposition leading to home hospice care?
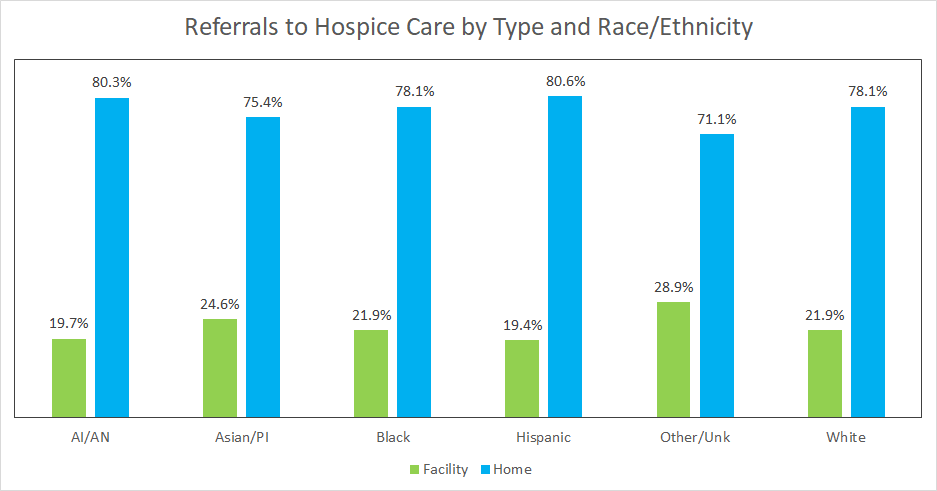
Figure 1. Referrals to Hospice by Type and Race/Ethnicity
On Day 4 we will learn how to explore Geographic differences in discharge dispositions across the state!