Day 4
🌐Geographic Information Systems
Mapping Census Data
Day 4: Where in the world?
1. Using open source GIS
2. Data types
3. Census data
4. OpenStreetMap
5. Merging public datasets
6. Making Maps
Install these plugins
- Go to plugins --> manage and install plugins and search for QuickOSM. This is the user interface for downloading OpenStreetMap data.
- Now download the plugins HCMGIS and MMQGIS.
- HCMGIS has many features including the ability to add baselayers
- MMQGIS allows us to create buffers and geocode for free
Mapping geographically referenced files
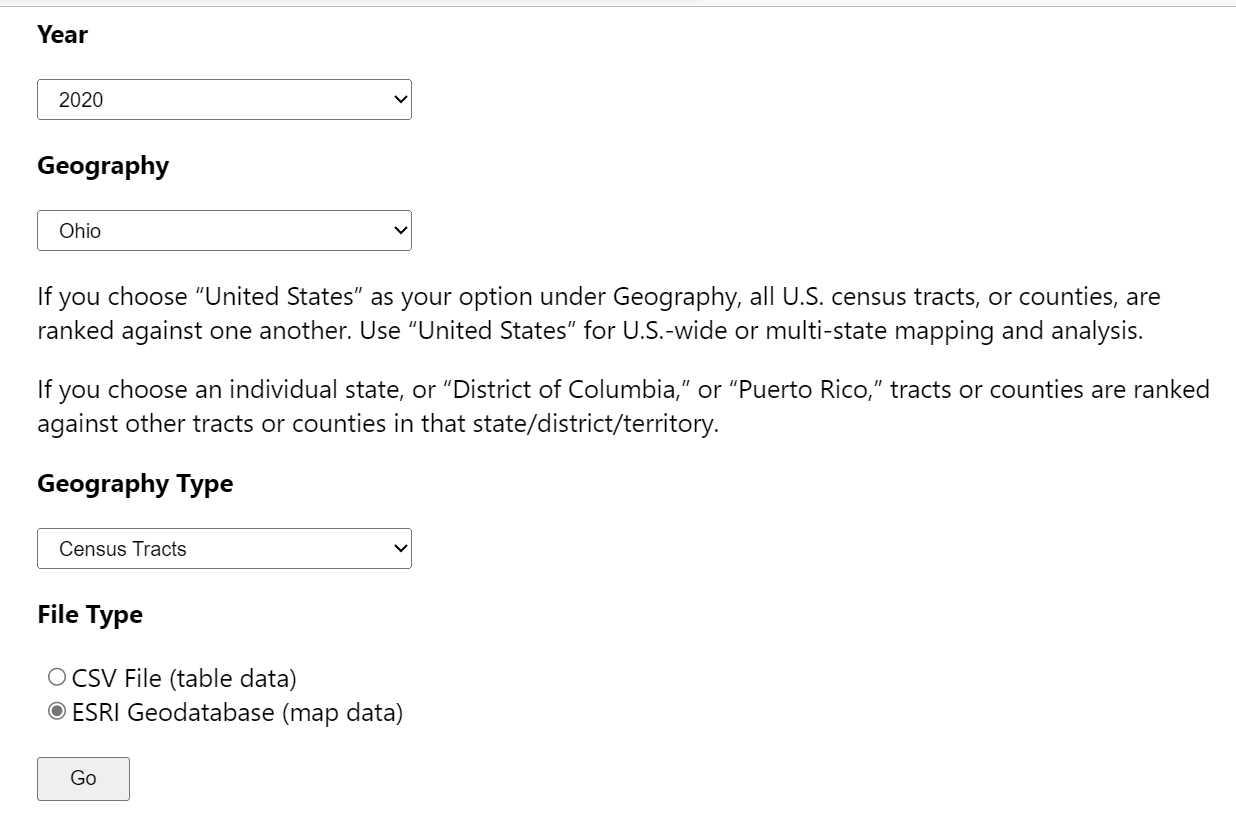
Example: the Social Vulnerability Index
-
Go to the CDC's Social Vulnerability Index website
-
Download the data for Ohio
-
Instead of downloading the csv file make sure you choose these specifications
-
Now we can map social vulnerability in Ohio
Merging and Mapping
Example: Mapping Hospice Referrals from California
- On Day 1 we looked at data on hospice referrals from California. The data were at the county level.
- Now we can map these data across the state
- Go back to Example 1. We created a pivot table that summarized the number of referrals across the county
- I made this data available to you in the Day 4 data folder under hospice called referrals_county.csv. Open it.
- To map these data we only need to download the boundary file for the state of California and then merge the hospice data to it
- TIGER/Line® Shapefiles (census.gov)
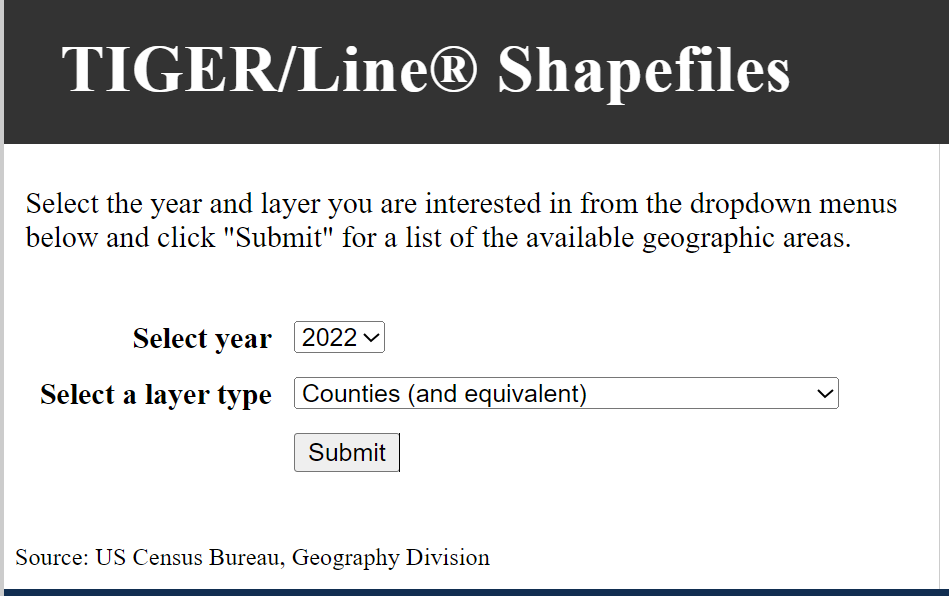
- Note: these are shapefiles. After you unzip the file for California, locate the file with the .shp extension. That is the file that needs to be added to QGIS. You can drag the file right into the canvas (or insert it from the file menu)
Choropleth Mapping
Example: Mapping Crimes in Washington DC
- Go to the Washington DC open data portal
- Find and download the 2010 census tract data (boundary files) and the 2010 crime data
- Make sure you download the geographic files (i.e. the geojson or shapefile)
- Now we can map crimes in census tracts in Washington DC
- Now download the primary and secondary streets in Washington DC using OpenStreetMap
- Clip the streets to the census tract boundary
- Apply a different style to the street
Mapping Multiple Overlapping Datasets
Example 4: Mapping Homelessness in San Diego
Here are the steps
- First, we need the boundary file for Downtown San Diego. The file is in your day 4 data folder. The file is saved as a geojson file. Drag the file into the QGIS canvas
- Open the shapefile, look at the GEOID10 field. This is the census block group
- Open count_by_blkgrp.xlsx, this is the file we looked at on Monday that has the homeless person counts located here http://library.metatab.org/sandiegodata.org-dowtown_homeless-2.1.1/data/homeless_counts.csv
- Notice that in the file, the GEOID has some extraneous numbers. Those numbers need to be removed for the merge.
- Recall on Tues I mentioned that each grouping of numbers means something. For example, the “06” is the FIPS code for California and “039” is LA county
- We can use an EXCEL formula to remove the numbers
- What is the 3 digit code for San Diego County?
- Then notice that the census block groups need to be aggregated before they are mapped. In GIS, when making a choropleth map, you must have a 1-1 relationship because your data needs to be mapped to one census block group
- Use pivot tables to aggregate the data. Then copy and paste the data to a separate csv file. QGIS uses csv files
- Now we can merge the data to the shapefile of downtown and recreate the map on the website. See San Diego Regional Data Library data example (bigdataforsocialjustice.github.io)
- Note: you must have an “0” before the “6” in the GEOID field, i.e. it must be a text field
- From QGIS go to Layer --> Add Layer --> Add delimited layer. Make sure these options are checked
- 