Exploring Unsheltered-ness in San Diego
The San Diego Regional library has a number of really cool datasets including one on 'homelessness'. From the main website click on 'Homelessness' or Homelessness – SDRDL Data Repository (sandiegodata.org)
I have used this data from this repository to explore mental and physical health of unsheltered individuals previously see A Network Analysis of the Relationship Between Mental and Physical Health in Unsheltered Homeless Persons in Los Angeles County (sagepub.com)). This data used
LA Homelessness Demographic Survey
We are going to look at the data set called Downtown San Diego Homeless Sleepers which includes multiple years of data on monthly geographic positions for homeless sleepers in Downtown San Diego
❓ Your turn
- Read the web page that contains the Homeless sleepers data and familiarize yourself with the contents
- Describe two limitations associated with these data
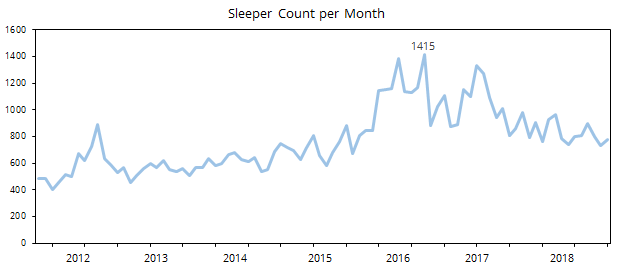
- The website shows the following time series chart that compares the sleeper count with official counts. Let's recreate this chart.
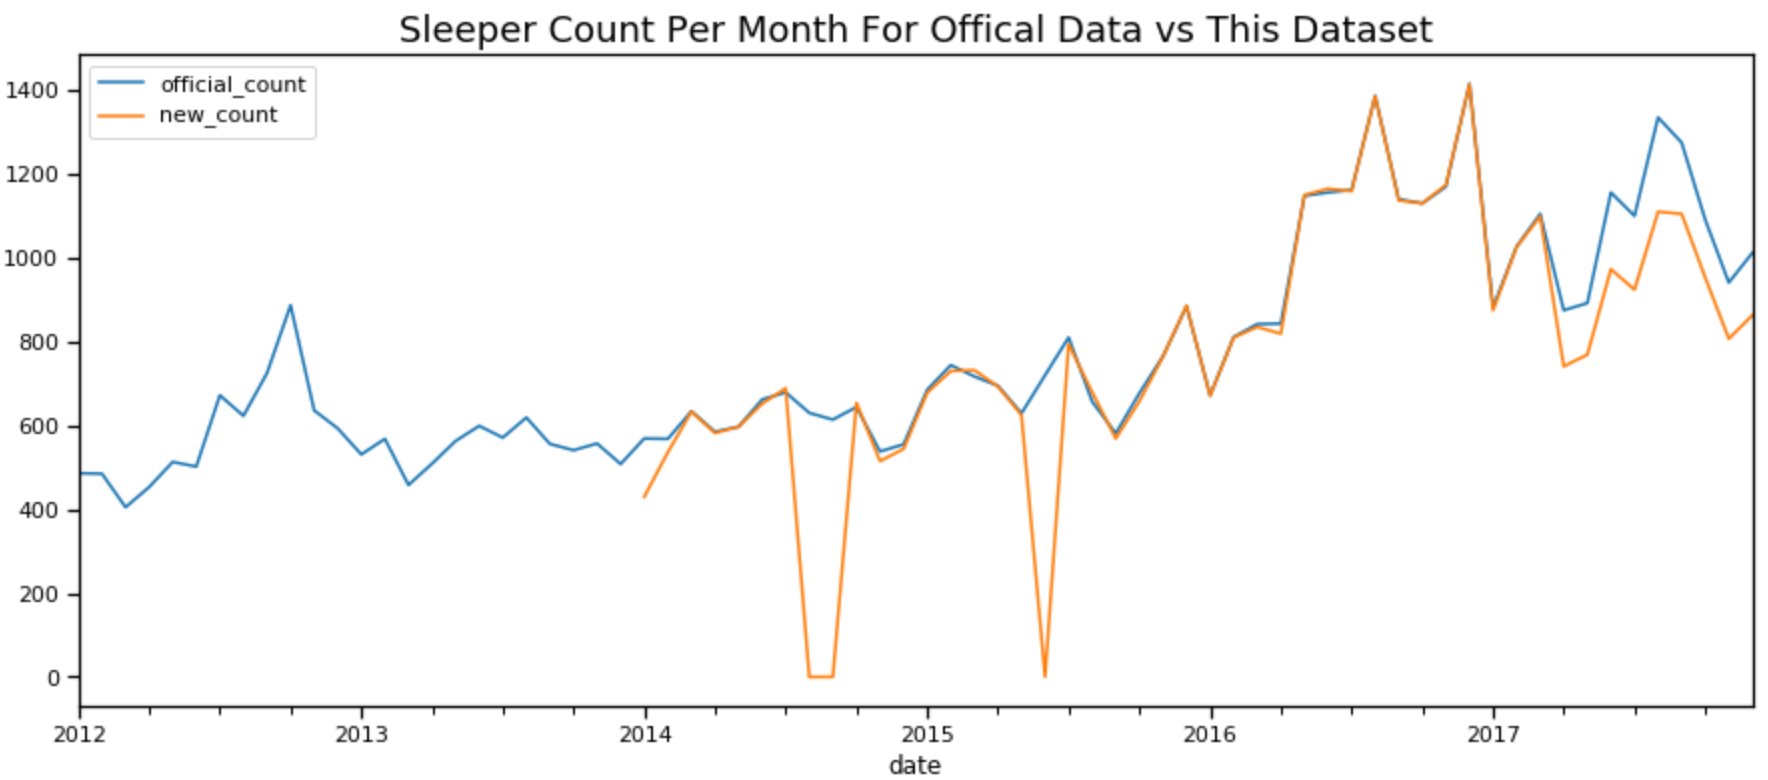
- Download the Monthly totalsdataset
- I created this chart using Excel. Notice that you can use Excel's formatting tools to make this chart look almost exactly like the one created using the Python programming language!
- The excel spreadsheet titled sleeper_count.xlsx has two tabs. Open the file and recreate the chart.
Next, notice that they provide a map of the homeless county by block group for the downtown area.
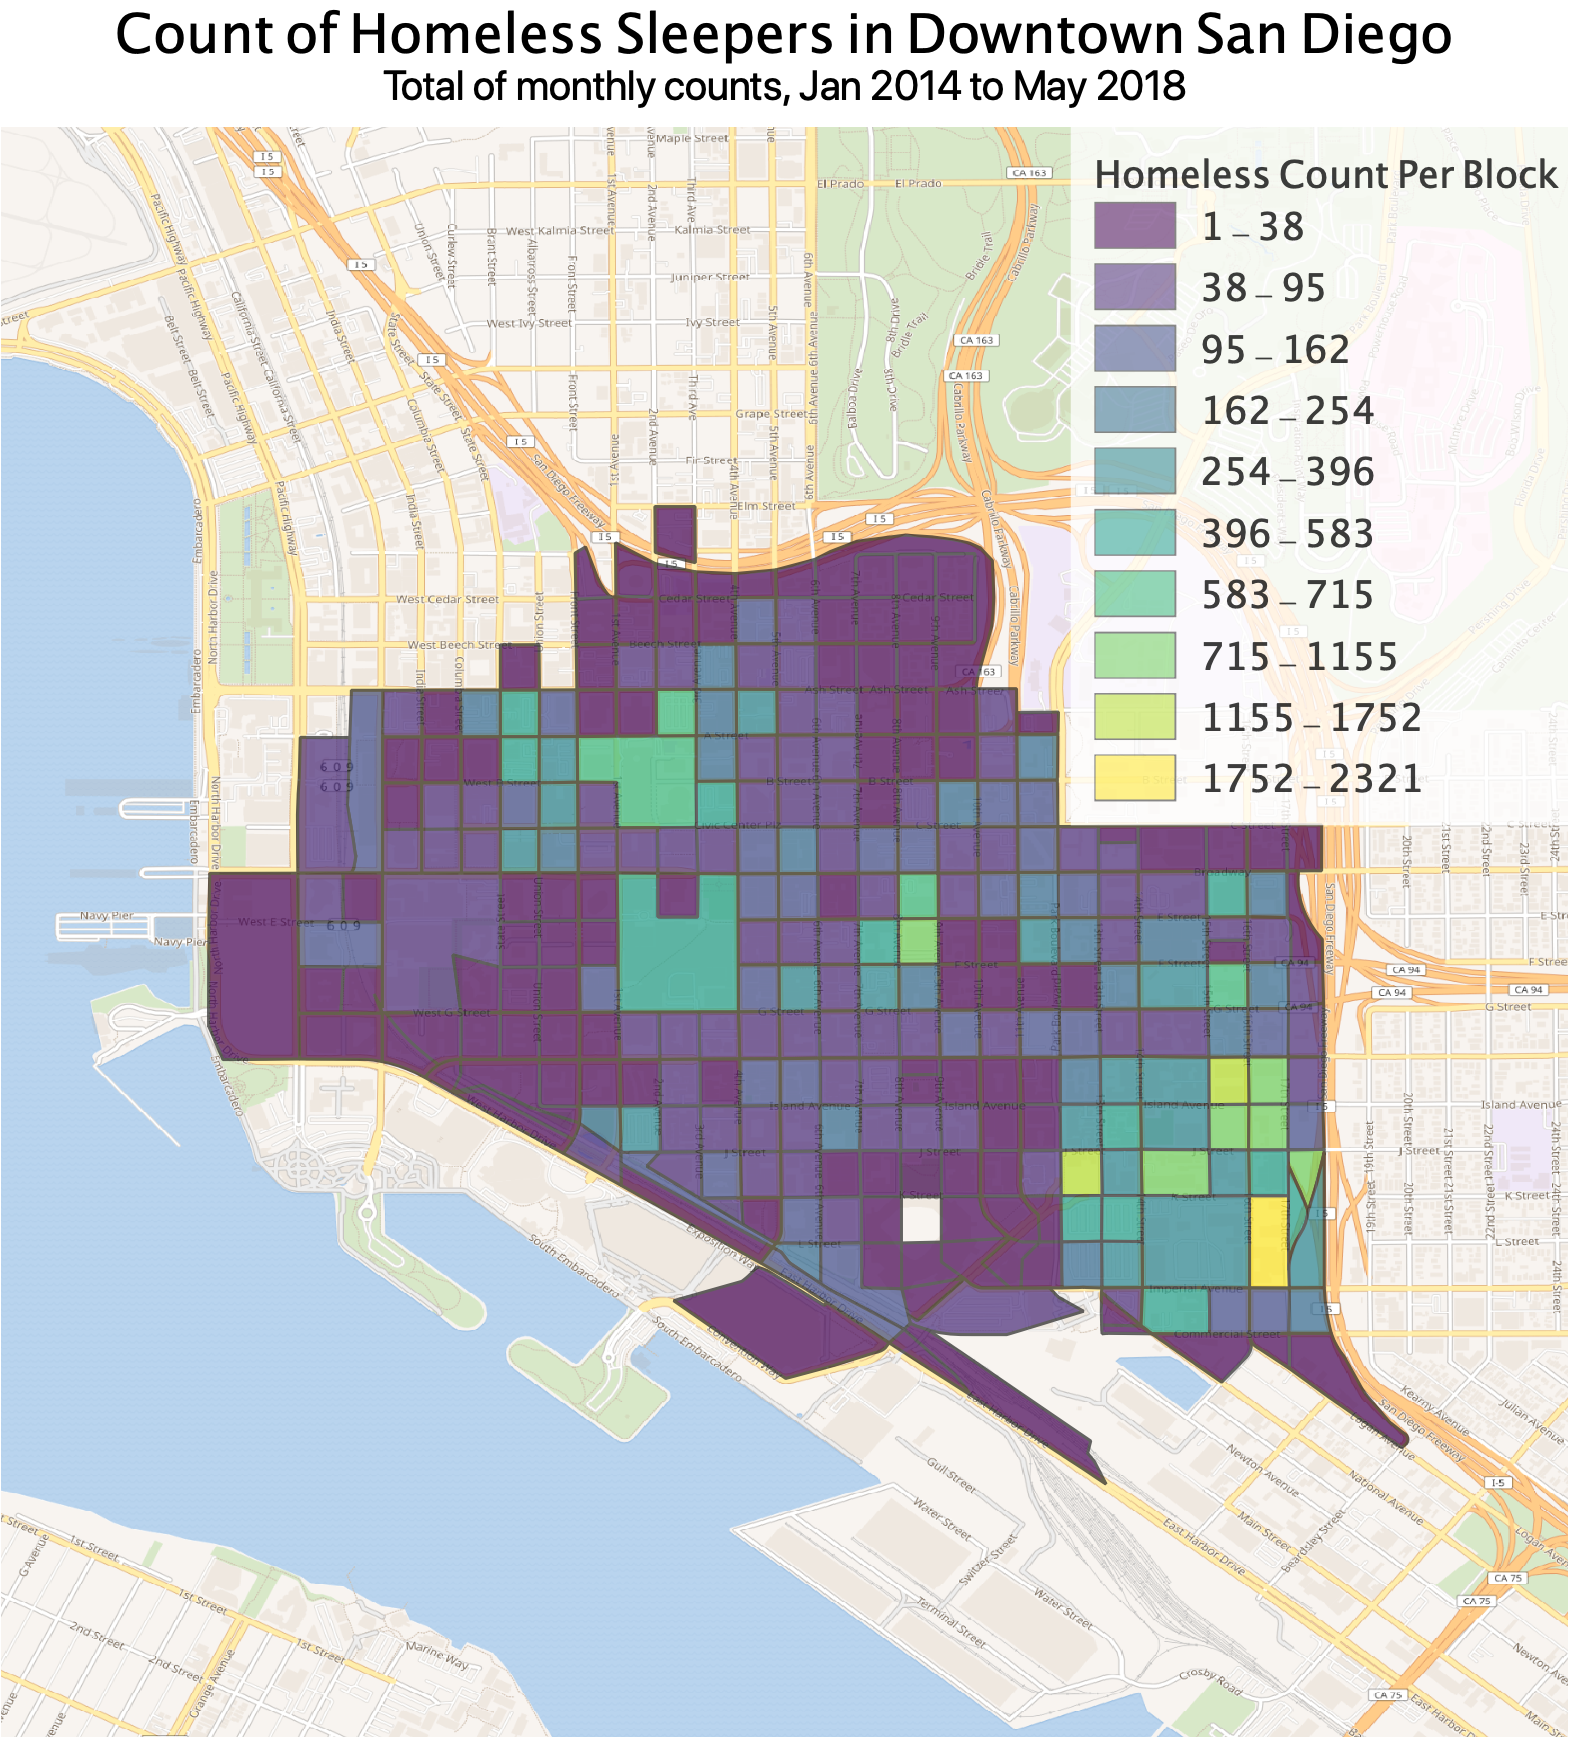
Let's compile the data so that on Day 4 we can actually map it.
- Download the file called homeless_counts or open the file called count_by_blkgrp.xlsx in your bootcamp folder (ex/homelessness data)