Bringing it all together
Assignment 1
Follow the examples on working with Add Health data, in this assignment you will:
- use data downloaded from a web repository (Add Health) (Day 1)
- Identify multiple variables to use in the analysis (Day 1)
- Clean, merge, recode and create new variables (Day 2)
- import the data into jasp, jamovi or SPSS (Day 2)
- run a simple analysis (Day 3)
- create APA formatted tables and visualizations (Day 3)
- draw conclusions
Follow these steps for Assignment 1
I am interested in the association between race/ethnicity and child maltreatment. If you recall, the Add Health data asks questions about experiences in early childhood retrospectively. That is, in Wave III, they ask respondents (who are now in their 20s) to report on experiences they had in childhood (prior to the 6th grade).
-
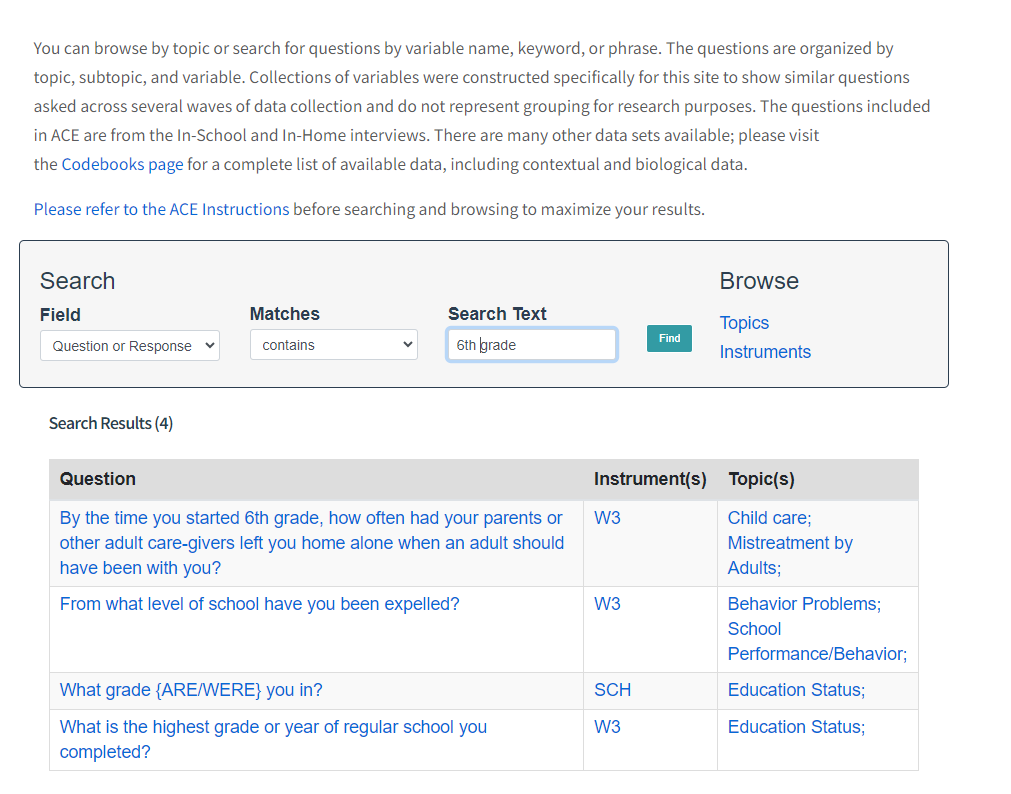
Identify the child maltreatment variables in the online codebook from Wave III (see below, the topic is 'Mistreatment by Adults'). One of the questions is "By the time you started 6th grade..."
-
Select the Race/Ethnicity variable from Wave I. After looking at the codebook, label the variables. Hint, use this variable
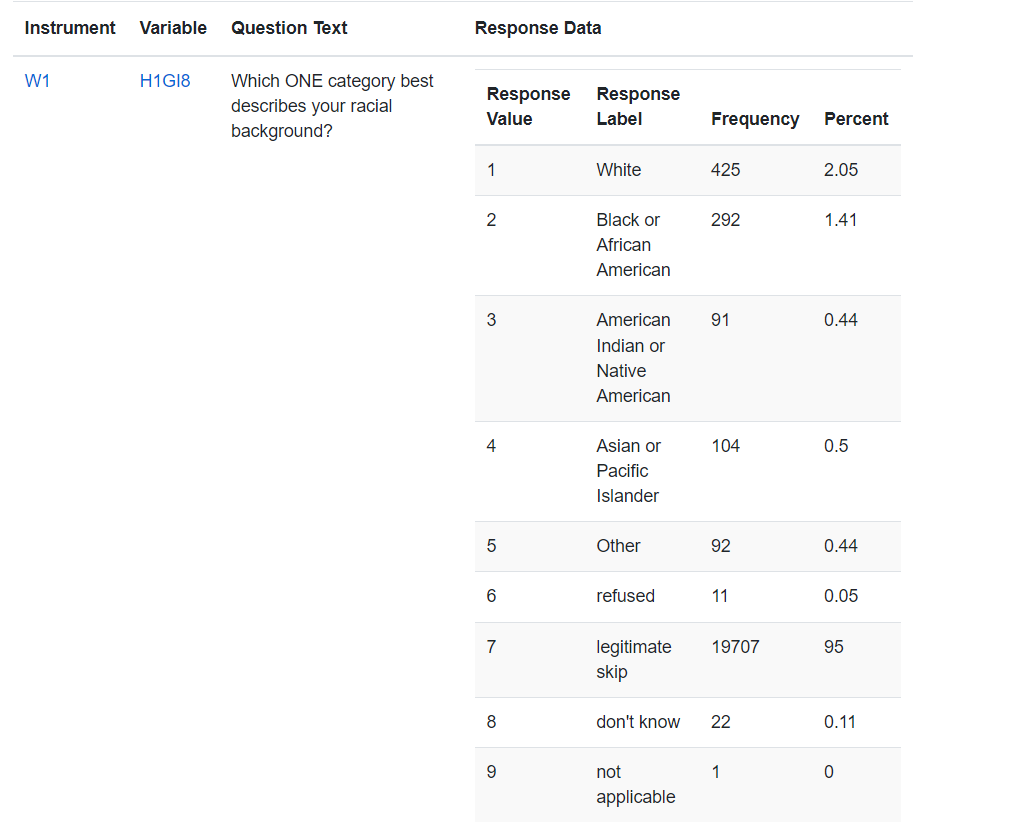
-
Merge the Wave III data on mistreatment with Wave I data on race. This will be a one-to-one merge like you did in class. Export the file to a csv and import it into jamovi or jasp.
-
Create a table of mistreatment by race/ethnicity.
-
Choose one visualization we discussed and illustrate the relationship between mistreatment and race/ethnicity.
Assignment 2
Follow the examples on mapping data, in this assignment you will:
- download data from an online repository
- import the data into QGIS
- filter the data
- merge the data with a boundary file
- map the data
Follow these steps for Assignment 2
-
Go to the Cook County Medical Examiner Case Archive Medical Examiner Case Archive | Cook County Open Data (cookcountyil.gov)
-
Filter the data to return rows where Race = Black and gun violence = TRUE (Hint: I did this below)
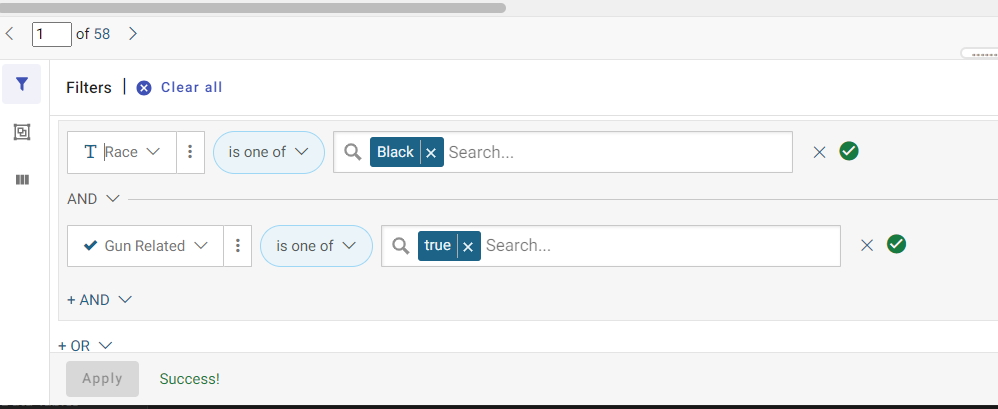
-
Download the shapefile of census tracts in Cook County, Chicago from TigerLine/Census website
Hint: the county FIPS for Cook County is 031, so filter the data such that "COUNTYFP" = '031' -
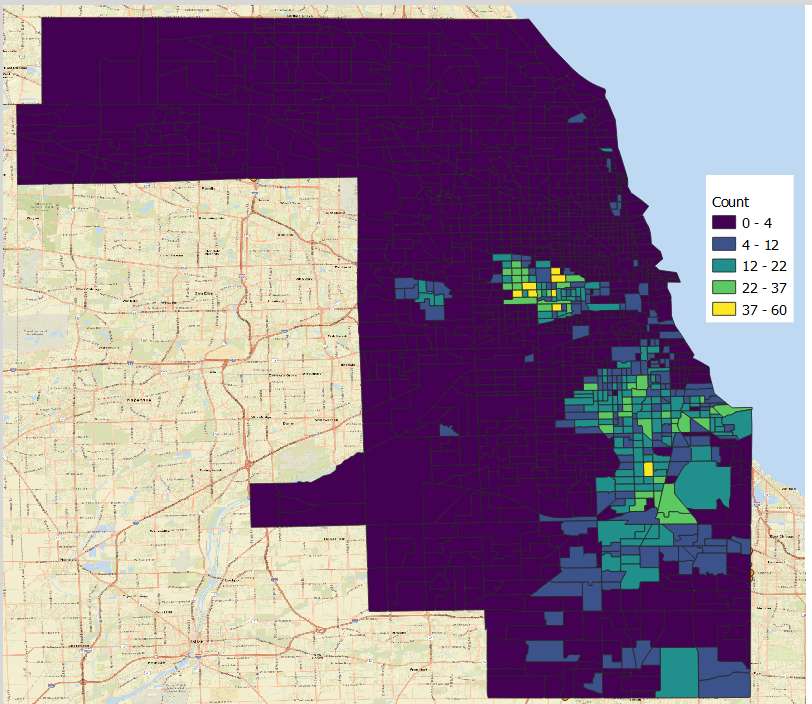
Aggregate the homicide data to the census tracts in Cook County
-
Make a choropleth map of the deaths. You should have something that looks like this (Note: I added the basemap called ESRI Street)