The National Survey of Children’s Health (NSCH) is sponsored by the Maternal and Child Health Bureau of the Health Resources and Services Administration, an Agency in the U.S. Department of Health and Human Services.
The NSCH examines the physical and emotional health of children ages 0-17 years of age. Special emphasis is placed on factors related to the well-being of children. These factors include access to - and quality of - health care, family interactions, parental health, neighborhood characteristics, as well as school and after-school experiences. Read more https://www.census.gov/programs-surveys/nsch.html
The Research Question
- I want to know (1) the prevalence of TBI in this sample; and (2) if there is a relationship between ACEs and TBI.
The Process
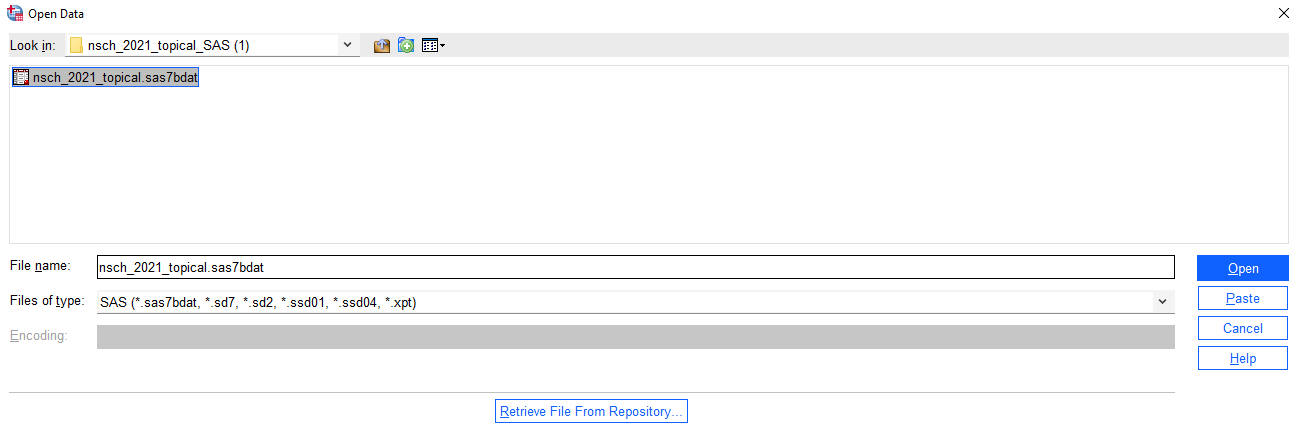
Download the data
Click on the # 2021 NSCH Data Release and download the 2021 Topical Data and Input Files as a SAS dataset
SPSS can import SAS files
Find the variables and variables names in the codebook
The variable list is located here
Locate the variables corresponding to TBI/Concussion in the dataset using the search function
Locate the ACE questions in the dataset. (For some reason, in this dataset ACE2 is missing, the variables are ACE1, ACE3 ... ACE12). This is the first dataset that contains ACEs on the basis of race, sexual orientation and living with a health condition.
There are other candidates for ACEs in this dataset such as whether the child is safe at school (K10Q41_R) and safe in the neighborhood (K10Q40_R)
Clean up value labels
First, we need to associate values for each variable.
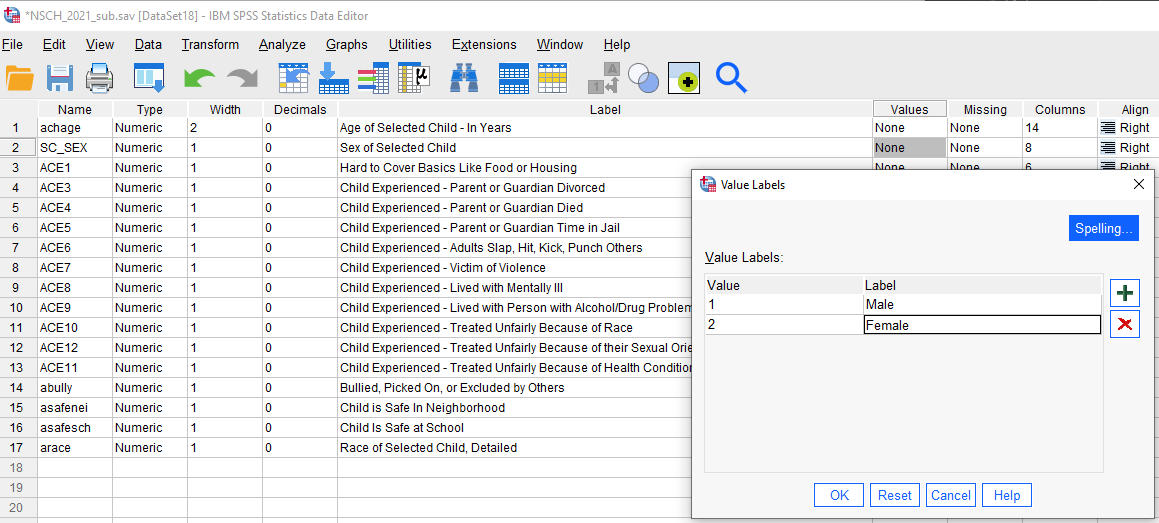
To do so, we must go back to the codebook. For example, if we run simple frequencies on the variable SC_SEX (sex of child), we have no idea if 1 = male and 2 = female or vice versa. Let's do that now.
In the Variable View next to the variable SC_SEX, click on the three dots in the Values Column. Click on the + sign and enter "1" in the Value column and "Male" in the Label column as per the codebook provided above. Do the same for female. Click OK.
Provide the values for each of the variables in the dataset.
Hint: if the values for a variable are the same, you can copy and paste to make things go more quickly. Also, there is no need to provide labels for continuous variables, like age.
Redefine and recode variables as needed
Let's redefine the variables, create an ACEs scale that ranges from 1 - 11 (for the 11 ACEs measured), and then use jamovi and SPSS to explore the research questions presented above.
Take a close look at the basic needs variable and you notice that
- it needs to be reverse coded to be consistent with the other ACE variables; and
- it is not possible to sum across variables if the levels of the variables are different. In other words, the 'hard to cover basic needs' variable has 4 levels but the other ACEs are measured as yes/no.
SAVE the cleaned dataset as NSCH_2021_sub.sav
Now I am going to recode the variables again and create an ACEs scale. Then, we can correlate the scale with TBI controlling for race, age and sex of the child.
Run the analysis
RQ1: About 7% of children have had a traumatic brain injury
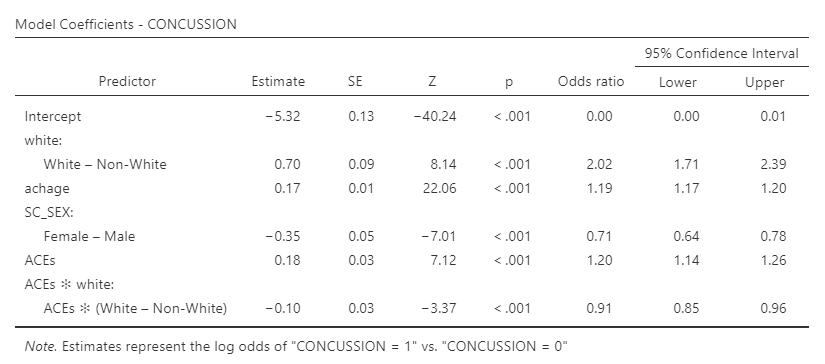
RQ2: There is a significant association between ACEs and TBI. Each additional ACE increases the odds of a TBI by about 20%. Further, white children are more likely to have a TBI compared to children of color.
There is also an interaction between ACEs and race on the likelihood of a TBI.
Each additional ACE increases the odds of TBI about 10% more for black children compared to white children. Below are a few charts that help us visualize the results.
And of note, this should be published. Before that happens, more variables need to be added to the model (what would you suggest?)