Mining Homicides in Los Angeles County
Background
The new documentary called "The Trials of Gabriel Fernandez" brings to the forefront the horrendous abuse that children in Los Angeles County and elsewhere endure at the hands of their caregivers. The documentary is a six-part miniseries about the 2013 murder of Gabriel Fernandez, an 8-year old Palmdale boy, that aired on Netflix February, 2020. In 2013, Gabriel Fernandez died in the neighborhood of LA county called Palmdale. For years, Gabriel was abused by his mother and her boyfriend. The abuse included being beaten, shot with a BB gun, smothered with pepper spray, made to wear girl’s clothes to school, forced to eat his own vomit, and locked in a cabinet with a sock stuffed in his mouth. His biological father was incarcerated previously. From 2003 – 2012 over 60 complaints were filed leading to 8 investigations by Child Protective Services. His mother and her boyfriend were given life sentences for his death. The social workers were charged with felony child abuse and falsifying public documents.
The case of Gabriel Fernandez demonstrates the complexity of the risk factors and the profound psychological impact that fatal child maltreatment has on members of the community. It also highlights aspects of our social, legal and criminal justice systems that are in desperate need of reform. Gabriel’s teacher, family and even the prosecutor discussed the psychological toll it took on them. Apparently, their pleas for help from Child Protective Services were of no avail.
What first piqued my interest about this case is that it happened again, about 5 years later, when 4-year old Anthony Alvalos was murdered 15 minutes from Garbiel’s home. The cases were almost identical, even regarding the fact that Anthony’s parents thought he, too, was gay.
My Work
As a researcher of child abuse and neglect, I have known about the Gabriel Fernandez case for years. My own work explores the structural aspects of child welfare across time and space. If I could boil this work down to one central message it would be that neighborhood characteristics, in addition to the characteristics of children and families, are critical components of child maltreatment prevention. Nevertheless, the characteristics of neighborhoods are often overlooked in preventive interventions. The characteristics of neighborhoods are important to understand for many reasons. One of the most important reasons is because they reflect the structural components of race and class and how they play themselves out in the area of child abuse.
The Problem
One difficulty that I have encountered in my research is the lack of data on child abuse and neglect, particularly that which pertains to child homicides. This has forced me to think outside the box about data and data collection efforts. As a methodologist, as well, I understand full well that innovative methods of machine learning are going to be an important component of applied research. Whereas it is relatively easy to give answers to well-structured questions, when there is no structure to the data standard statistical analyses are inapplicable. Unstructured data makes up 80-90% of all data produced by organizations (Holzinger, Stocker et al., 2013) including police reports, court documents and human service organizations. In order to understand patterns in such data, machine learning algorithms such as text mining and topic modeling can help given meaning to narrative, unstructured text. Therefore, understanding the power of data science, including web scraping and text mining, is a critical part of developing a holistic approach to child protection. In this first article, I will illustrate how I created a dataset of all child homicides in Los Angeles County by scraping the Los Angeles Times Homicide report located here
The first step (see figure 1) in this project was to collect geospatial data on child homicides.
Preliminaries
I am using Python to perform the web scraping, data cleaning and mapping. Before you begin, make sure you have the latest version of Python installed on your computer. I used homebrew for the installation and it is straghtforward if you follow the steps listed here. Next, in order to scrape the website, you must make sure to install the following packages. To do so, you can type the following in the terminal window on a Mac or Unix machine:
pip3 install [package.name]
Below are the packages I used for the web scraping.
#pd.options.mode.chained_assignment = None # see https://stackoverflow.com/questions/20625582/how-to-deal-with-settingwithcopywarning-in-pandas
import urllib
from selenium.webdriver.support.ui import WebDriverWait
import numpy as np
import urllib
from urllib.parse import urljoin
from selenium.webdriver.chrome.service import Service
from webdriver_manager.chrome import ChromeDriverManager
from selenium.webdriver.support.ui import WebDriverWait
from selenium.webdriver.support import expected_conditions as EC
from selenium.webdriver.common.by import By
from selenium import webdriver
from selenium.webdriver.common.keys import Keys
from selenium.webdriver.chrome.options import Options
import time
from bs4 import BeautifulSoup as bs
import requests
import re
import pandas as pd
from pandas import ExcelWriter
Data Extraction
To understand the process, first go to the LA Times website and right under the map there is a search feature. Click the 'More' button to perform an advanced search. Click the down arrow next to the box that says 'Last 12 months' and select 'All years' (which is the last option). Then click the down arrow next to the box that says 'Age' and select 0-5. This search will result in all homicides to children under the age of 6 years old spanning 2000 - 2020. Some of the results are shown in figure 3.
If you go to the L.A. Times website, you will notice that the page loads dynamically. Therefore, flow is to wait for the webpage to load, grab the data, then simulate scrolling down the page in order to grab the next few homicides, and repeat until all of the homicide cases are downloaded.
chrome_options = Options()
chrome_options.add_argument('disable_infobars')
# Start the WebDriver and load the page
wd = webdriver.Chrome(ChromeDriverManager().install(), options=chrome_options)
#wd = webdriver.Chrome(options=chrome_options)
wd.delete_all_cookies()
wd.set_page_load_timeout(40)
#https://homicide.latimes.com/age/0/year/all') -- all children under 6
#wd.get('https://homicide.latimes.com/neighborhood/compton/cause/gunshot/year/all') -- compton gun homicides
wd.get('https://homicide.latimes.com/gender/female/year/all') #female gun homicides in the county
time.sleep(30)
html_page = wd.page_source
soup = bs(html_page, 'lxml')
result1 = soup.find_all('article', attrs={'post-teaser row'})
last_height = 0
while True:
wd.execute_script("window.scrollTo(0, document.body.scrollHeight)")
time.sleep(3)
html_page = wd.page_source
soup2 = bs(html_page, 'lxml')
time.sleep(2)
#break condition
new_height = wd.execute_script("return document.body.scrollHeight")
if new_height == last_height:
break
last_height = new_height
results = soup2.find_all('div', attrs={'post-teaser row'})
wd.quit()
all_deaths_under_6 = result1 + results
test = soup2.find_all('div', attrs={'post-teaser row'})
test1 = soup2.find_all('article', attrs={'post-teaser row'})
all_deaths_under_6_div = test + test1
print ('{} child homicides in LA County'.format(str(len(all_deaths_under_6_div))))
2724 child homicides in LA County
all_deaths_under_6_div[0]
<div class="post-teaser row">
<aside class="span2 offset1 hidden-phone">
<img class="post-list-thumb" src=""/>
<div class="post-list-badge">
Died on
<div class="death-date">May 28</div>
<ul class="badge-location">
<li>834 N. Austin Avenue, Inglewood, California 90302 County Los Angeles</li>
</ul>
</div>
</aside>
<article class="span8 post-list-content">
<hgroup>
<h2><a href="/post/lauren-alexandria-prarat/">Lauren Alexandria Prarat, 31</a></h2>
<p class="post-date">May 28, 2023</p>
</hgroup>
<div class="body">
<p> Lauren Alexandria Prarat, a 31-year-old <a href="/race/white/year/all">white</a> <a href="/gender/female/year/all">female</a>, died Sunday, May 28, at 834 N. Austin Avenue, Inglewood, California 90302 County Los Angeles, according to Los Angeles County Medical Examiner-Coroner's records. </p>
</div>
</article>
</div>
Results
There were 2724 females who were killed by a gun in the county since 2000
The code above grabbed all of the data that is on the website. The following code parses the text so that it can be stored as data in a data frame. To do so, it is necessary to find all of the unlinked lists (ul's) with class label 'badge-location' to store the child's name, death date, spatial coordinates (which are located in the tag for the image source, as well as the race, gender, age and cause of death listed by the medical-examiner, coroner. Finally, in order to perform textual analysis (e.g., Latent Dirichlet Allocation modeling) the code grabs the description of the details surrounding the death as well as the LA Times reporting of the death.
BASE_URL = 'https://homicide.latimes.com/'
url = []
uls = []
clist = []
cname = []
b = []
c = []
d = []
e = []
f = []
g = []
j=0
for r in all_deaths_under_6_div:
#Find all ul with class: badge-location
containers = r.findAll("ul",{"class" : lambda L: L and L.startswith('badge-location')})
for container in containers:
c_names = containers[j].findAll("li")
for i in range(len(c_names)):
c_name = c_names[0]
c_mod_name = c_name.text.split(',')
c_mod_name = [item.replace("\n", "") for item in c_mod_name]
c_mod_name = [x.strip(' ') for x in c_mod_name]
i +=1
cname = c_mod_name
death_date = r.find('div', 'death-date').text.strip()
if r.find('div', 'death-date').text.strip() is not None else ''
name = r.find("h2").text if r.find("h2").text is not None else ''
name = name.replace("\n", "")
try:
coords = r.img['src'].split("/")[8]
except IndexError:
coords = ''
pass
except TypeError:
coords = ''
pass
post_date = r.find('p', 'post-date').text.strip()
if r.find('p', 'post-date').text.strip() is not None else ''
race = r.find("a", href=re.compile("race")).text.strip()
if r.find("a", href=re.compile("race")) is not None else ''
gender = r.find("a", href=re.compile("gender")).text.strip()
if r.find("a", href=re.compile("gender")) is not None else ''
cause = r.find("a", href=re.compile("cause")).text.strip()
if r.find("a", href=re.compile("cause")) is not None else ''
s_descript = r.find('div', 'body').text.strip()
if r.find('div', 'body').text.strip() is not None else ''
a = r.find('a', href=re.compile("post"))
url = urljoin(BASE_URL, a.attrs['href'])
soup = bs(urllib.request.urlopen(url).read())
title = soup.find('section', class_="body")
article_text = ''
article = soup.find('section', class_="body").findAll('p')
for element in article:
article_text += '\n' + ''.join(element.findAll(text = True))
article_text = article_text.replace("\n", "")
data = soup.find('ul', class_="aspects")
for d in data:
lis = data.findAll('li')
for k in range(len(lis)):
try:
aname = lis[2]
t = [lis[0].text, lis[1].text,lis[2].text,lis[3].text,lis[4].text,
lis[5].text, lis[6].text]
myString = "::".join(t )
myString.replace(' ', '0')
a,b,c,d,e,f,g = myString.split('::')
k +=1
except IndexError:
pass
clist.append((cname, death_date, post_date, name, race, gender,
cause, coords, s_descript, article_text, c, d, e, f, g, a, b))
j+=1
In order to see the article text (stored in position 9) for the 10th record type the following:
This returns the text narrative associated with row 564
clist[564][9]
'Maria Urriola De Pastore, a 69-year-old Latina, died Monday, March 27, after being beaten in the 3600 block of West 106th Street in Inglewood, according to Los Angeles County coroner’s records.\xa0Inglewood police responded\xa0at 12:45 p.m.\xa0to a call about a fight at a house, according to coroner’s records.\xa0They found Pastore seriously wounded. Her husband, Genaro Pastore, was bleeding from his face and unresponsive, records show.The Pastores were transported to the hospital, where\xa0Genaro Pastore, 64,\xa0was pronounced dead at 1:18 p.m., according to coroner’s records.Maria Pastore\xa0arrived at the hospital in critical condition and fell\xa0into a coma. She died at 1:58 p.m.\xa0March 27,\xa0coroner’s records show.Detectives said the couple was attacked by their daughter’s ex-boyfriend, Edward Fernando Ruiz, 33. On the day of Genaro Pastore’s death, Ruiz went to his ex-girlfriend’s house and attacked her, then fled before police arrived. While the woman was transported to a hospital, Ruiz returned and beat her parents, police said.\xa0Later that day, officers found Ruiz hiding on a nearby rooftop. After a two-hour standoff, he climbed down and was arrested.\xa0Prosecutors charged Ruiz with two counts of murder, as well as one count each of resisting an officer, injuring a child’s parents after a prior conviction and violation of a court order.\xa0On April 3, Ruiz’s attorney questioned his client’s\xa0sanity, and Ruiz was sent for a mental health evaluation. He is scheduled to return to court Sept. 6 for results of the exam.\xa0Contact the Homicide Report. Follow @jeromercampbell and @latimeshomicide on Twitter.'
This woman was attacked by her daughter’s ex-boyfriend, Edward Fernando Ruiz, 33. The circumstances surrounding the death are clear: On the day of her death, her daughter's ex-boyfriend went to her daughter's house and attacked her daughter before returning to beat her and her husband, both of whom died as a result of the attack.
The data needs to be cleaned and preprocessed prior to visualization. The code below cleans a few of the columns that will serve as preliminary analyses.
df = pd.DataFrame(clist, columns=['c_name', 'death_date', 'post_date', 'name', 'race', 'gender', 'cause', 'coords', 's_descript', 'article_text', 'c', 'd', 'e', 'f', 'g', 'a', 'b'])
df['post_date'] = df.post_date.str.replace('Posted' , '')
df['causes'] = df.e.str.replace('Cause:' , '')
df['brace'] = df.f.str.replace('Race/Ethnicity:' , '')
df['hood'] = df['a'].str.replace('href','')
df['post_date'] = df['post_date'].str.replace('Jan. 18, 2007, noon', 'Jan. 18, 2007')
df['post_date'] = df['post_date'].str.replace('Oct. 10, 2007, noon', 'Oct. 10, 2007')
df['post_date'] = pd.to_datetime(df['post_date'])
df['year'], df['month'], df['day'] = df['post_date'].apply(lambda x: x.year), df['post_date'].apply(lambda x: x.month), df['post_date'].apply(lambda x: x.day)
df[['y', 'x']] = df['coords'].str.split(',', n = 1, expand = True)
df[['x', 'd']] = df['x'].str.split(')', n = 1, expand = True)
df.apply(lambda x:'%s, %s' % (x['death_date'],x['year']),axis=1)
df[['d1', 'y']] = df['y'].str.split('(', n = 1, expand = True)
Save file for later processing
df.to_csv('female_shot_all.csv', sep=',')
Now we can visualize the data
First, filter and clean some of the data for the plot
df = df[['causes','x', 'y', 'brace']]
df1 = df[df['brace'].str.contains("Black") | df['brace'].str.contains('White')| df['brace'].str.contains('Latino')| df['brace'].str.contains('Asian')]
df1 = df[df['causes'].str.contains("Blunt force") | df['causes'].str.contains('Gunshot')| df['causes'].str.contains('Stabbing')| df['causes'].str.contains('Strangled')]
df1
.dataframe tbody tr th {
vertical-align: top;
}
.dataframe thead th {
text-align: right;
}
| causes | x | y | brace | |
|---|---|---|---|---|
| 102 | Gunshot | 33.98166149582505 | -118.30918538353123 | White |
| 103 | Stabbing | 33.77912959584337 | -118.19406418354725 | Black |
| 104 | Gunshot | 33.8924981958331 | -118.29064368353382 | Black |
| 105 | Blunt force | 34.056642995818336 | -118.23177148354199 | Black |
| 106 | Gunshot | 33.892855995833074 | -118.24874548353962 | Latino |
| ... | ... | ... | ... | ... |
| 2706 | Gunshot | 33.897855996706 | -118.2340869835372 | Latino |
| 2707 | Gunshot | 34.221928 | -118.454991 | Latino |
| 2708 | Gunshot | None | None | White |
| 2709 | Gunshot | None | None | White |
| 2710 | Gunshot | None | None | White |
2265 rows × 4 columns
Within Jupyter we can run R code
This uses ggplot to make a bar chart of causes of death by race of the female
from plotnine import *
(ggplot(df1) +
aes(x='causes', fill = 'brace') +
geom_bar(alpha=.4, position="identity") +
ggtitle('Cause of Death') +
labs(x = "Cause of Death", y = "Count", fill = "Race/Ethnicity")
)
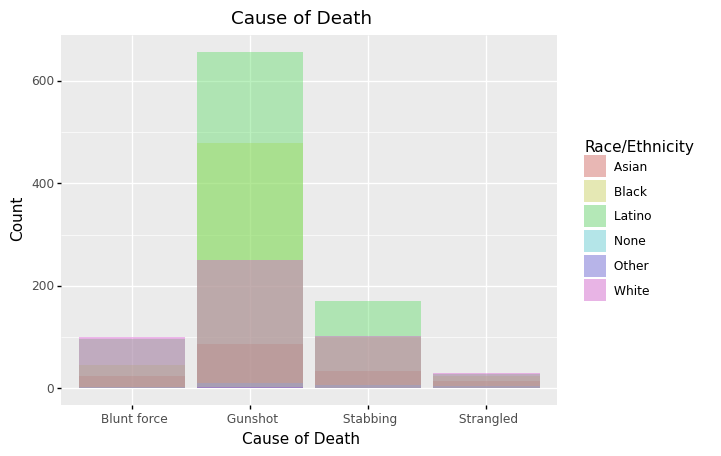
From the chart above, the most common cause of death is gunshot, and Latina and Black women are numerically more likely to due by gun shot.
df_complete = df.dropna(subset=['x', 'y'])
df_complete['y'] = pd.to_numeric(df_complete['y'], errors='coerce')
df_complete['x'] = pd.to_numeric(df_complete['x'], errors='coerce')
Mapping the results
Acquire shapefiles and transform the data rame into a spatial data frame
We create a spatial points data frame and download neighborhood boundaries from the LA Times website. Then we can get a sense of where females are relatively more likely to die.
import geopandas as gpd
from geopandas import GeoDataFrame
from shapely.geometry import Point
shape=gpd.read_file('/Users/gbarboza/Downloads/la-county-neighborhoods-v5/l.a. county neighborhood (v5).shp')
geometry = [Point(xy) for xy in zip(df_complete.y, df_complete.x)]
#df_complete = df_complete.drop(['x', 'y'], axis=1)
crs = {'init': 'epsg:4326'}
gdf = GeoDataFrame(df_complete, crs=crs, geometry=geometry)
import matplotlib
import matplotlib.dates as mdates
from matplotlib.ticker import StrMethodFormatter
import matplotlib.pyplot as plt
import seaborn as sns
import os
from mpl_toolkits.basemap import Basemap
fig = plt.figure(figsize=(9, 5))
#Let's create a map centered over Los Angeles, CA (34.0522° N, 118.2437° W) and extending 10 degrees W-E and 5 degrees N-S
my_coords = [34.587234,-118.126193]
map = Basemap(projection='merc',llcrnrlon=-121.,llcrnrlat=33.,urcrnrlon=-116.,urcrnrlat=35.,resolution='i') # projection, lat/lon extents and resolution of polygons to draw
# resolutions: c - crude, l - low, i - intermediate, h - high, f - full
map.drawcoastlines()
map.drawstates()
map.drawcountries()
map.drawlsmask(land_color='Linen', ocean_color='#CCFFFF') # can use HTML names or codes for colors
map.drawcounties() # you can even add counties (and other shapefiles!)
map.drawmapboundary()
# Plot the data
mxy = map(gdf["y"].tolist(), gdf["x"].tolist())
map.scatter(mxy[0], mxy[1], s=3, c="#1292db", lw=4, alpha=1, zorder=5)
x, y = map(my_coords[1], my_coords[0])
zoom_scale = 1
map.plot(x,y,marker='D',color='r', markersize=14)
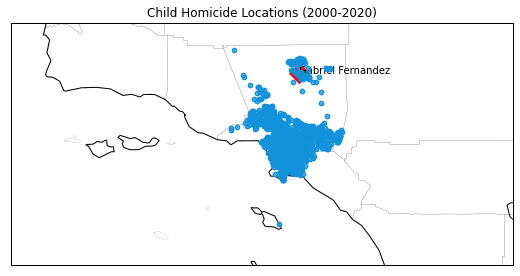
plt.text(x, y, 'Gabriel Fernandez')
plt.title("Child Homicide Locations (2000-2020)")
plt.savefig('gabriel_fernandez.png', format='png', dpi=500)
plt.show() #draw map
f, ax = plt.subplots(1, figsize=(12, 12))
f.patch.set_facecolor('xkcd:white')
shape.plot(ax=ax, color='white', edgecolor='gray' , alpha=0.8, linewidth=.9)
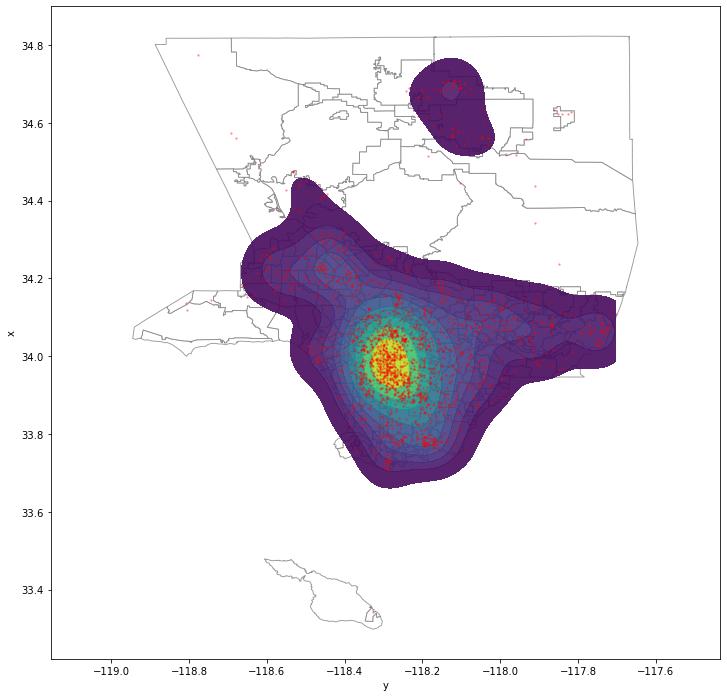
sns.kdeplot(gdf['y'], gdf['x'], n_levels=10, cmap="viridis", shade=True, shade_lowest=False, ax=ax, linewidths=2, bw_adjust=1, alpha=.9, kernel='gau',gridsize=150, bw='scott',cut=0,cbar=False)
ax = gdf.plot(ax=ax,marker='o', color='r', markersize=2, alpha=0.3)
plt.axis('equal')
plt.show()
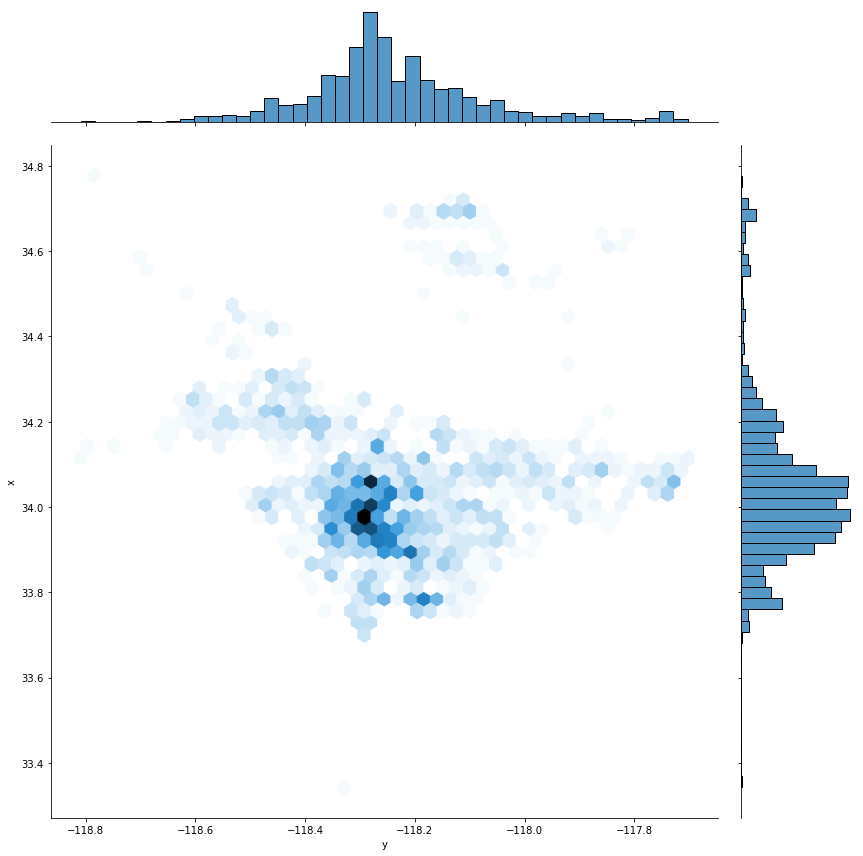
graph = sns.jointplot(x = 'y',y = 'x',data = gdf,kind = 'hex', height = 12)
Summary
The maps above show the locations of child homicides across the county. The maps show a strong spatial clustering in the city of Los Angeles. The number of child homicides decreased over the years, however it is possible that we see an increase in child deaths due to maltreatment as a result of the COVID-19 outbreak. These data should be monitored so that preventive interventions can be targeted to the communities that are in most need.