Analyzing the consumer complaints database
Debt during COVID-19?
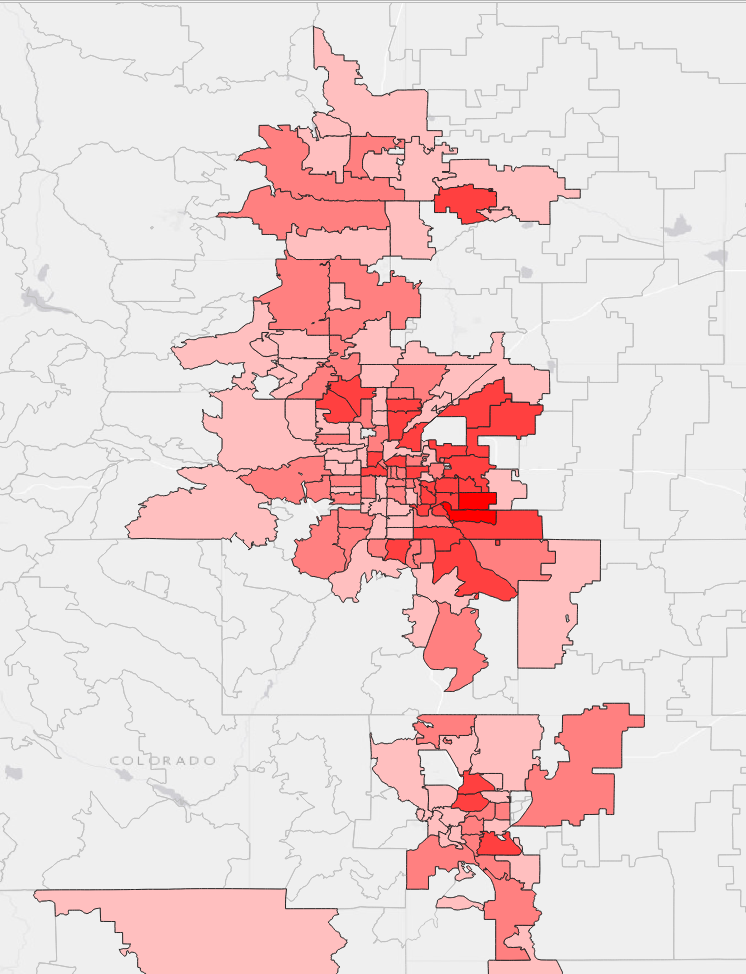
I am very interested in debt particularly regarding housing and particularly during COVID-19. I was living in Colorado and downloaded all of the complaints for that state. There is a zip code field in the data associated with the home residence of the complainant. I aggregated the data by counting all complaints within zip codes and mapped them by zip code using QGIS.
You will need to get the ZCTA shapefile from the Tiger/Line(R) Census website and you will need to create a pivot table in Excel that counts all complaints by Zip code.
Merge the data to the shapefile by Zip Code to create this map.
Fig. 1. Consumer complaints by Zip Code in Colorado
Filtering the Complaints database
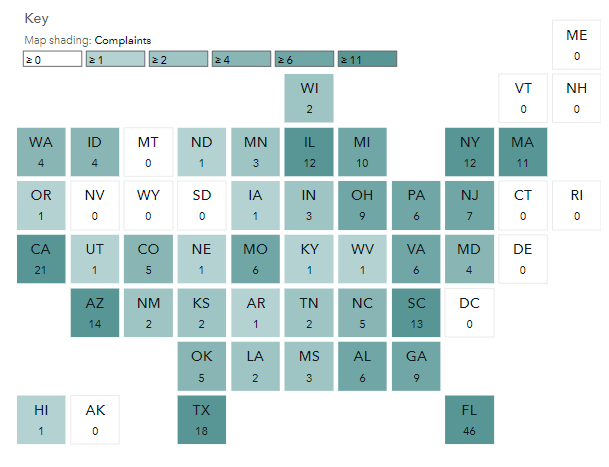
Of course we are interested in family well-being. I searched through the reports for the word "divorce" during phase I of the pandemic from 3/14/2020 - Aug 5, 2020. Click here) to see my filtering of the data.
You can copy this map right from the website. It shows the map of the number of complaints during Phase I of the pandemic that included the word 'Divorce.'
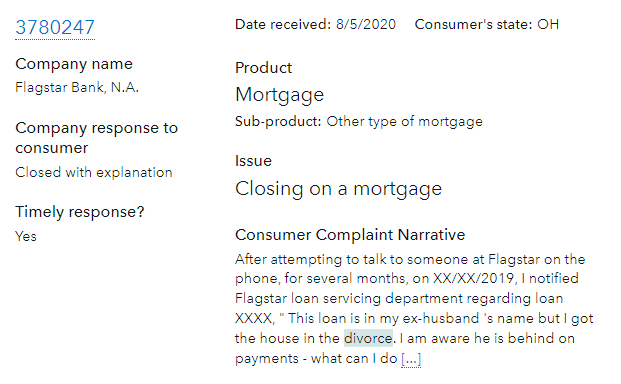
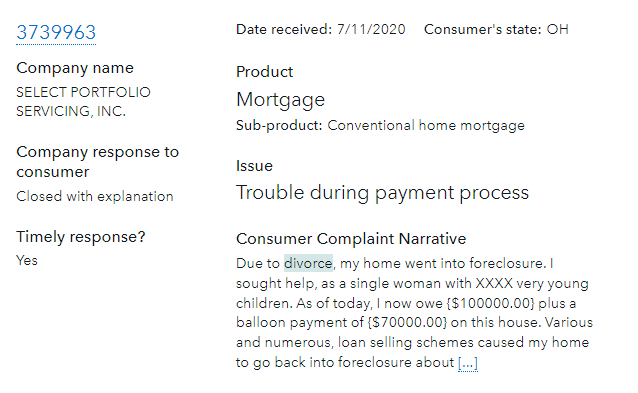
Here are a few of the narratives associated with these complaints from Ohio:
It is sad to note how divorce affects families, including foreclosure, which impacts children as well. In fact, much of my work involves issues of housing insecurity and child abuse or neglect. Theoretically, it seems that debt is a big source of strain and conflict in families due to stress, and that may increase the likelihood of child health.
These data are fully downloadable and you can use write Excel formulas to search through the text field and retrieve narratives to inform your research.


